Engage: Building Loyalty and Co-Creating With Customers
Pierre-Yann Dolbec
Overview
This last chapter covers activities associated with the Engage stage: how to evaluate and encourage customer engagement and loyalty and foster co-creation by engaged customers. We discuss the importance of customer engagement, customer lifetime value, ways to measure engagement, consumption communities, and co-creation activities.
Learning Objectives
Understand the concepts of engagement and loyalty, how to calculate customer lifetime value and its importance in marketing strategy, how to measure engagement, and how to create value with consumers.
Engage
A widespread definition of engagement attributed to Forrester is “creating deep connections with customers that drive purchase decisions, interaction, and participation, over time.” Accordingly, the two objectives of the Engage stage are to (1) foster loyalty and (2) co-create value with customers.
Key performance indicators at this stage help measure a firm’s success in attaining these objectives and the achievement by consumers of associated goals. KPIs include the number of shares, brand mentions, referrals, repurchases, and reviews as well as the ratio of comments to posts, comments to likes, and reviews to sales.
The Engage stage is central for many reasons. Perhaps most importantly, recent research shows that loyalty leaders “grow revenues roughly 2.5 times as fast as their industry peers and deliver two to five times the shareholder returns over the next 10 years” (HBR). Working on increasing engagement is thus profitable. There are a few factors that explain this.
Acquiring customers is much more costly than retaining and selling to existing ones, and repeat consumers tend to spend more than new ones (Forbes). Engaged consumers are also more willing to interact with you, facilitating market research and leading to groundbreaking insights. This is particularly true since you can develop winning engagement strategies by identifying what makes your loyal customers loyal. Last, engaged customers work on your behalf, co-creating content that, as we’ve seen, is used by other consumers throughout their journey.
To better understand the value of customers over their lifetime with a company, we turn our attention to the concept of customer lifetime value. We then look at two tools that can help us better understand and measure customer loyalty. We conclude the chapter by examining value co-creation.
Customer Lifetime Value
Customer lifetime value (CLV) represents a customer’s profitability over their entire relationship with the business. A straightforward way of thinking about CLV is as follows:
CLV = average profit per sale (AP) × number of repeat transactions in a period (RTP) × retention time (RT)
Please note, however, that this is a simplistic approach used to illustrate this concept and not something we would recommend using in a real-life setting.
Let’s use the example of a subscription business (i.e., period = 1 month). The business has a churn rate of 2%. Churn rate represents the rate of customers leaving a company per period (Wikipedia). In this case, the company is losing 2% of its customer base every month. Churn rate is useful to calculate the average retention time of customers: By dividing 1 by the churn rate, we obtain the retention time. In this case, customers stay with the business for an average of 50 months (or 1 divided by 0.02).
The average profit per sale is $30.
The number of repeat transactions per period is one, because customers are making one transaction per month and the period we are looking at here is one month.
The CLV is thus
CLV = AP × RTP × RT.
Since AP = $30, RTP = 50, and RT = 1,
CLV = 30 × 50 × 1 = $1,500.
Over their lifetime, each customer brings the business $1,500.
CLV draws our attention to the importance of catering to the lifetime of a customer with a business. The first sale to a customer is not what typically brings revenue to a firm. Acquisition costs for a customer are generally much higher than the revenue a firm will make on its first sale. Thus, the objective of firms is to engage customers to increase their lifetime value.
More concretely, CLV can play many roles for a firm. For example, it helps firms price their customer acquisition strategies and calculate their return on investment. This is important because it helps evaluate whether acquisition strategies are profitable and manage marketing efforts more generally.
Continuing with the example above, let’s assume the firm is running a PPC search ad campaign to acquire customers. In this simple example, let’s further assume that people search for something, click on an ad which leads them to a landing page, and convert to customers from this landing page.
The total campaign cost is $20,000, including all campaign elements (i.e., developing the landing page, all costs related to ads, etc.).
The campaign gets 2,500 visitors on their landing page.
The conversion rate is 5%, meaning that the firm converted 5% of the 2,500 visitors to their landing page. That works out to 125 customers (2500 × 5% = 125).
The cost per acquisition is thus $160, or $20,000/125.
At this stage, firms will be asking themselves, “Is this profitable? What is my return on investment? Should I continue running this acquisition strategy campaign?” CLV becomes useful at this stage.
As a reminder, this firm earns $1,500 per customer on average throughout their lifetime with the company. Even if the company only makes $30 on the first sale (meaning that they just “lost” $95, since it cost them $160 to acquire the customer), two rules of thumb help us see that this is a profitable customer acquisition strategy over time.
The two rules of thumb to quickly gauge whether a customer acquisition strategy is profitable are:
- Am I recovering my cost per acquisition over the next 12 months of the life of the customer with my business? In this case, the answer is yes: The company will make $360 per customer (AP × 12 = $30 × 12 = $360).
- Is my CLV more than three times my cost per acquisition (CAC) (that is, CLV/CAC > 3)? In this case, the answer is also yes. CAC is $160 while CLV is $1,500, and CLV/CAC = 9.375. In fact, the firm should be happy to pay up to $500 per acquisition.
Among many other uses that CLV serves, it can also support retention and customer support strategies central to the Engage stage. By knowing the lifetime value of customers, firms can more easily price retention and support strategies, i.e., how much to put into trying to retain customers.
CLV varies per persona, where some personas will be worth more over their lifetimes than others. This helps firms to decide where to spend extra resources and which personas to pamper a bit more. It can also help a firm see whether it should “fire” a persona, i.e., minimize the efforts dedicated to customers already acquired and stop acquisition strategies for a specific persona if their CLV is drastically lower than that of other personas.
Lastly, it is important to keep in mind that, apart from subscription businesses such as the example above, customers rarely bring in the same amount to a firm throughout their lifetime. The relationship between a customer and a firm evolves over time, and it is important to recognize that the journey of customers expands beyond their first purchase with a firm. Not only does this vary between personas, but it might also vary between markets. In some markets, such as videogame consoles or eyewear, products are seldom sold, with an extended period between purchases that might encourage churn. In other markets, like groceries, consumers are continuously making purchases over their lifetime. As is the case in the market for diapers, other markets might see a significant uptick at the start of the customer’s life with a company and then declining sales over time as, in the case of diapers, the baby ages into a child. Although the new approach is predictive analysis, some earlier analytical tools, such as RFM analysis (discussed in the next section), provide information regarding some of these aspects. They also help us understand the basics of analyzing customer behavior to make strategic decisions.
RFM Analysis
RFM, which stands for recency, frequency, and monetary value, is a long-standing analytical method that helps analyze and segment customer behavior based on the recency of their last purchase, the frequency of their purchases, and their monetary value, i.e., how much they spend with the firm.
By helping firms understand the purchasing behavior of acquired customers, RFM analysis can help increase retention and purchase per customer, identify which customers are not so great, better, and best, whether we are experiencing issues with a specific persona in terms of repurchase behavior, and so on.
To conduct an RFM analysis, a firm starts with its customer database. The first step is to assign value to customers associated with their recency, frequency, and monetary value. Since RFM analyses can be done by operationalizing these variables differently, let’s assume here that recency refers to the recency of the last purchase in days, frequency to the frequency of purchases over three months (or a quarter), and monetary value to the total amount spent during this period.
Firms will often start by indicating the exact number associated with each variable and move to create categories for each. For example:
| Recency | Frequency | Monetary value | |
| 1 | Very recent | Very frequent | High value |
| 2 | Recent | Frequent | Medium value |
| 3 | Not recent | Infrequent | Low value |
They will perform their analysis with these categories.
We can then create segments by combining these together. The following table shows examples of such segments, where “x” stands for any number (i.e., its value is not important for defining that segment).
| Segment | Recency | Frequency | Monetary value |
| Best customers | 1 | 1 | 1 |
| Loyal customers | x | 1 | x |
| Big spenders | x | x | 1 |
| Lost or almost lost customers | 3 | 1 | 1 |
| Thrifters | 3 | 3 | 1 |
Then, each customer will be coded based on the categories created above, as shown in the following table.
| Customer | Recency | Frequency | Monetary value |
| Jack | 3 | 3 | 1 |
| Jill | 1 | 1 | 1 |
| Bill | 3 | 1 | 2 |
| Sean | 3 | 1 | 3 |
| Raymond | 2 | 2 | 2 |
| Tom | 1 | 1 | 1 |
| Tina | 3 | 3 | 1 |
| Mariah | 2 | 3 | 2 |
| Sanjit | 1 | 3 | 3 |
| Todd | 1 | 2 | 3 |
| Becky | 1 | 1 | 1 |
| Seth | 2 | 3 | 2 |
| Caroline | 3 | 2 | 1 |
This allows firms to categorize customers into the categories just created (e.g., best customers, loyal customers, etc.). These categories of customers can help decide which segments to concentrate on and what kind of strategy to use to engage customers. Examples could include performing retention campaigns with big spenders, recuperating almost lost customers, or moving loyal customers to increase their monetary value over time. A firm could also target its best customer segment: send an appreciation letter, analyze their personal preferences for more personalized offers, or generally develop strategies to keep this segment highly satisfied.
Although simple, RFM analysis is a useful tool to foster engagement. A more thorough analysis could combine RFM with personas and evaluate whether personas also share commonalities or differences in their purchasing behaviors, leading to the creation of even more personalized campaigns.
Net Promoter Score
Another approach to measuring customer satisfaction and engagement that is widely used is the net promoter score (NPS). Described by the Harvard Business Review as “the one number you need to grow,” NPS is associated with a single, one question survey based on customer engagement that has shown over time to be a great predictor of firm success.
To calculate the NPS, a firm first asks the following question to its customers: “How likely is it that you would recommend our company/product/service to a friend or colleague?” (Note: NPS has also been used in the past with other types of respondents, such as employees or resellers, depending on which population a company wants to measure). Respondents are asked to answer using a 0 to 10 scale, with 10 being “extremely likely” and 0 being “not at all likely.” The NPS is then calculated by subtracting the percentage of detractors from the percentage of promoters. The result ranges from −100% (all detractors) to 100% (all promoters) (Figure 9.1).
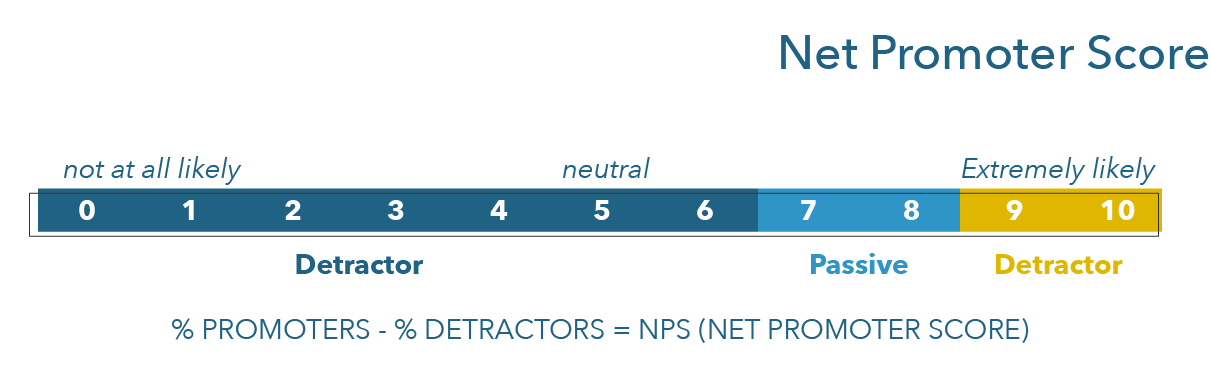
Promoters are those who answer 9 and 10. They are satisfied, loyal customers that will definitely recommend a brand to others. They are considered to exhibit value-creating behaviors, such as repeat buying, higher average basket, and longer retention time. They account for most referrals for a brand. Firms are advised to learn from promoters: What makes them so satisfied and engaged? Do they belong to a specific persona? How were they acquired? Promoters can be used to identify a winning formula that can potentially be replicated with other customers.
Passives are those who answer 7 and 8. They are satisfied customers who mostly neutral about their experience with a brand. Firms are advised to work toward converting passives to promoters.
Detractors are those who answer 6 or less. They are generally unhappy customers that will not recommend a brand to others. They might engage in value destructive behaviors, such as negative word of mouth. They have a high churn rate. Firms are advised to recover detractors. They can also ask themselves questions similar to those for promoters: What makes them unsatisfied with the brand? Do they belong to a specific persona? How were they acquired? For example, if a firm learned that specific a persona was responsible for most detractors, that should affect its future strategy in terms of where to dedicate customer acquisition efforts.
Engaging Customers in Co-Creation Activities
Co-creation refers to the joint creation of value by a company and its customers (Prahalad and Ramaswany 2004). Nowadays, most marketing activities can be co-created with consumers, whether those activities be market research, product innovation, advertising campaigns, or customer support.
We can categorize consumers into two broad categories of co-creators. The first category is composed of user innovators or lead users, highly involved and highly competent consumers who participate in co-creation activities to answer their own needs or desires. This is the kind of co-creator that MIT professor Eric Von Hippel has been studying since the mid-1980s. Lead users have been found to co-create value with firms in diverse markets, such as 3M and surgeons in the medical industry, amateur and professional athletes in sports as varied as windsurfing, rollerblading, snowboarding, and rodeo kayaking (e.g., Shah 2003), or computer geeks and open source software in IT (Von Hippel 2005).
The second category of co-creators is everyday consumers. These co-creators are people who are not particularly involved in a product category or particularly competent. They will probably not benefit from their co-creation activities. They participate in co-creation activities because it serves their needs (e.g., taking on the role of a clerk when using an ATM or self-checkout), because it is part of their activities with a company (e.g., co-creating content when we post social media content), or because it is fun (e.g., participating in a contest where we can choose the name of a product or redesign an ad).
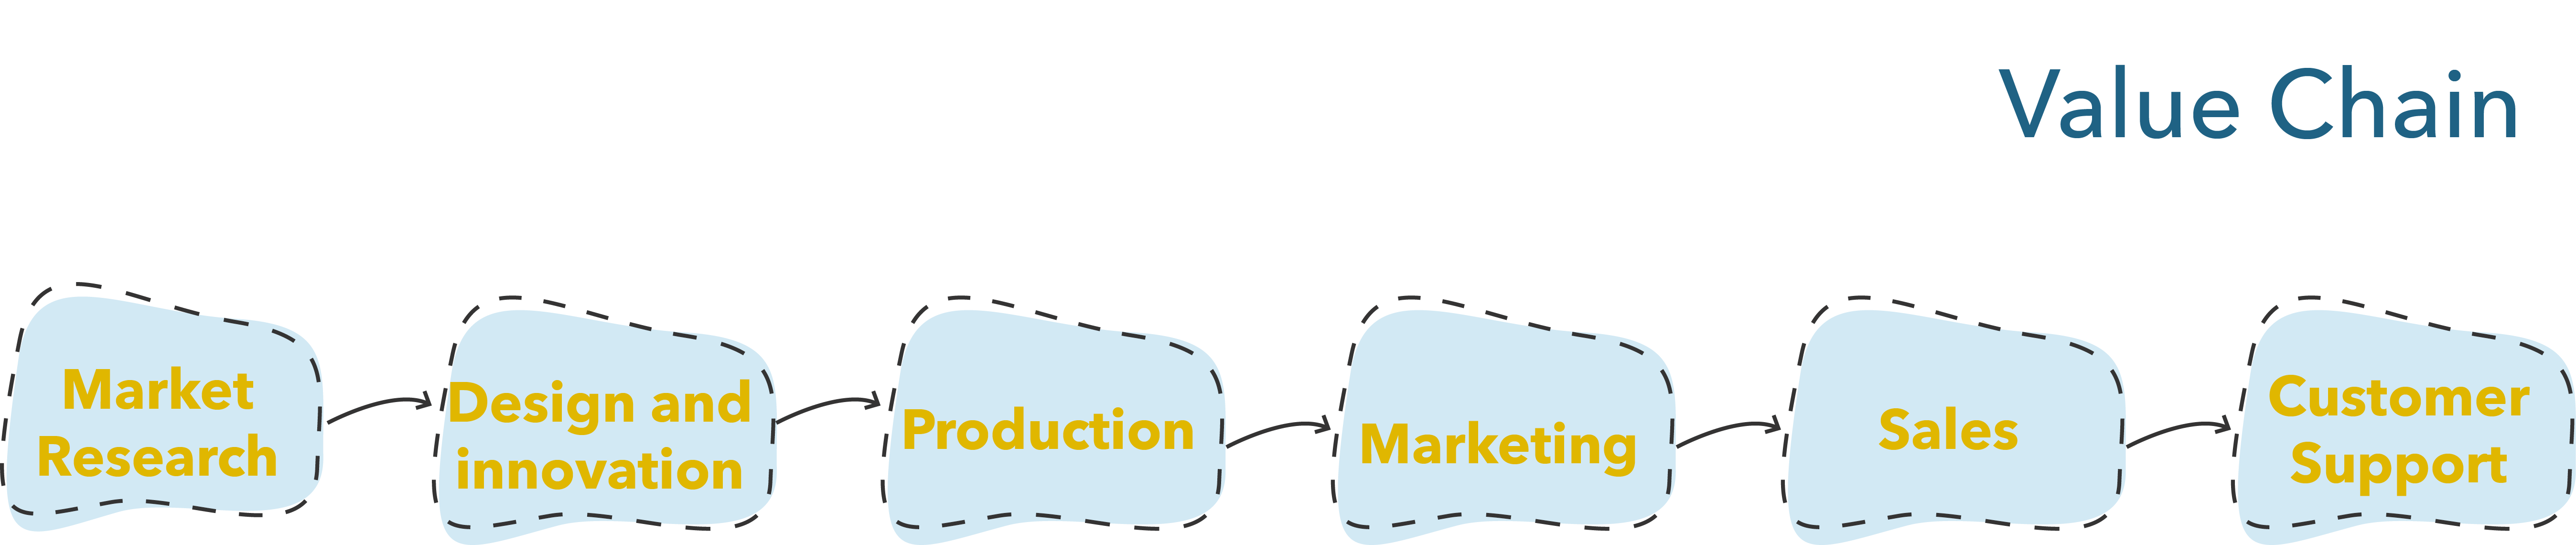
A useful tool for thinking about how consumers can participate in co-creation activities is the value chain. The value chain is a tool that helps conceptualize where value is created in firm activities. For example, the marketing function can be thought of as the set of activities shown in Figure 9.2 (text version here), through which a firm creates value for itself and its customers.

Each of these activities can create value. For example, market research creates value by leading to a better understanding of consumers and their needs. Innovation helps create products that address those needs. Production creates value by turning a concept into reality. Marketing creates value by attracting sales and customers, and sales create value by making these sales happen and distributing products to consumers. Customer support creates value by maximizing retention and satisfaction.
The value chain helps us understand how to co-create value with consumers by emphasizing where they can create value. Let’s see how value can be co-created during each of these activities.
For market research, one of the most obvious ways that consumers co-create value is by sharing their opinions with firms. For some companies, this mechanism has been formalized outside of ad hoc research efforts. For example, DeWalt set up an “Insight Community,” which they use to send several surveys per week to interact with consumers. By using this community rather than traditional market research firms, they estimate they saved about $5 million in market research costs in 2016 alone. Another example of value co-creation in market research is crowdsourced market research firms such as Trendwatching. Trendwatching publishes regular reports on emerging trends in different markets. To create these reports, they rely on an international community of trend watchers that are part of its TrendWatching Global Insight Network (tw:in) who are tasked with spotting emerging trends and sharing them with the company.
For design and innovation, there are many examples of companies who have tasked consumers with coming up with innovative ideas. Examples include initiatives where everyday consumers discuss new product ideas with firms, such as Lego Ideas and BMW Co-Creation Lab. Other initiatives pitch lead users in competition against one another, such as the Heineken Open Design and the Anheuser-Busch “King of Beers.”
At the production stage, examples vary. In our everyday lives, we all contribute to co-producing social media content, which we then consume from one another. Social media is mostly a co-created activity. Although we all follow celebrities with audiences of varying sizes, content producers are often other consumers like you and me. The business model of social media firms aims to provide a platform for co-creation (and monetize this platform with ads), but users are those who produce what is consumed. For material products, there is some hope that the rise of 3D printing will lead to consumers being able to co-produce products at home. Even today, designs can be downloaded online, and consumers are responsible for manufacturing the product at home. This echoes other “maker” activities, such as sewing or knitting, where making something is the consumption activity (e.g., making a shirt from a pattern). Product customization, such as NikeID, is also an example of the co-production of products since consumers are tasked with making design decisions.
For marketing, any marketing campaign based on word of mouth, such as viral marketing, is a co-created marketing activity. In such campaigns, consumers become co-creators of the campaign by participating in its diffusion. Shareable content, such as Spotify yearly “Wrapped” or more traditional entertaining advertisements such as Dietz & Watson Dietz Nuts recruit consumers who become channels through which ads are diffused. In other campaigns, such as hashtag campaigns, consumers’ role as co-creator is heightened as they also co-produce content.
Similarly, sales can co-created by consumers when they share product links or promo codes or when they contribute to companies’ sales pitches by writing testimonials or positive reviews.
Lastly, consumers regularly co-create customer support. Forums where consumers answer each other questions, such as Apple Support Communities or Tesla Forums, co-create customer support. Consumers similarly answer one another’s questions in different ways, such as in communities not directly owned by brands. They also create content on blogs and social media channels such as YouTube to explain how they address some issues they might have faced.
Exercises
You are Spikeball (see the following video):
We want to create co-creation activities along the value chain.
Lead Users
- Who could be lead users?
- Find two co-creation activities that lead users can participate in.
The Remaining Four Co-creation Activities
- Find a way to identify everyday customers who are most likely to participate with you in co-creation activities.
- Find activities to integrate those everyday consumers.
Note: These six activities (two for lead users and four for everyday consumers) should target the six marketing activities of the value chain independently, i.e., one activity for market research, one for design and innovation, and so on.
