Drive Reduction and Optimal Arousal
Jessica Motherwell McFarlane
The Drive Reduction Theory
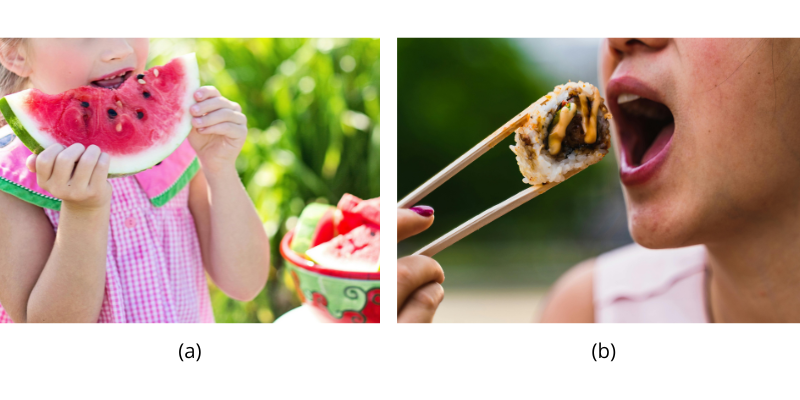
Drive Reduction Theory, developed by Clark Hull in the 1940s, is a significant concept in understanding human motivation. It is rooted in the idea that our primary drives, such as hunger, thirst, sleep, temperature regulation, elimination, sexual satiation, breathing, and pain avoidance, are crucial in directing our behaviour (Hull, 1943). These drives are essential for maintaining homeostasis, the body’s tendency to maintain a balance or optimal level within its biological systems. Think of homeostasis as your body’s way of keeping everything in balance, just like how you might try to balance your study, sleep, and social life. For example, at a summer music festival, you’re overwhelmed by intense thirst after hours in the sun, a clear sign that your body is out of balance. Desperately seeking hydration, you find a stand selling iced lemonade. The moment you drink it, the sweet, cold liquid quenches your thirst, instantly reducing the physiological tension and restoring your body’s homeostasis, perfectly illustrating Hull’s concept of balancing primary drives like thirst. This theory not only highlights the importance of physiological needs but also sets the stage for understanding more complex motivations that drive our actions, such as the pursuit of achievement, the need for belonging, and the search for emotional fulfillment. These additional drives, while not as immediately linked to physical survival, are equally vital in shaping our behaviour and guiding us toward a fulfilling and balanced life.

Here is a list of examples of some human drives:
- Hunger: The drive to consume food to obtain energy and nutrients. Remember how you feel when you skip breakfast and then can’t concentrate in your morning class? That’s this theory in action.
- Thirst: The drive to drink water to maintain hydration.
- Sleep: The drive to rest and rejuvenate the body and mind.
- Temperature Regulation: The drive to maintain an optimal body temperature.
- Elimination: The drive to excrete waste products, including urination and defecation.
- Sexual Satiation: The drive for engaging in sexual activity.
- Breath: The drive to intake oxygen and expel carbon dioxide, although this is so fundamental that it’s often taken for granted.
- Pain Avoidance: The drive to avoid physical injury and psychological harm.
The hypothalamus plays a crucial role in homeostasis. It receives signals from various receptors throughout the body, which are complex networks of neurons sensitive to different types of internal changes. For example, osmoreceptors in the hypothalamus monitor the body’s hydration level, while glucose-sensitive neurons detect blood sugar levels. Upon receiving signals from these receptors, the hypothalamus communicates with other parts of the brain and body to initiate response mechanisms. These responses can involve activating other neural pathways or signalling endocrine glands to release hormones. For instance, when blood sugar levels drop, the hypothalamus can trigger the release of hormones that signal the body to feel hungry, prompting eating behaviour to restore glucose levels.
Drive reduction theory suggests that deviations from homeostasis (when systems get unbalanced) create physiological needs, leading to psychological drive states that direct behaviour to meet these needs and restore balance. For instance, a drop in blood sugar levels induces a physiological need for food, leading to the drive state of hunger, which motivates the individual to eat. Eating then eliminates hunger, returning blood sugar levels to normal.
Beyond basic needs, secondary drives like seeking social approval, and habits formed from repeated actions like checking your phone, also influence our behaviour. Observing our daily routines, such as phone-checking, reveals how even non-survival actions are driven by underlying motivations.
While drive-reduction theory has been influential in understanding human motivation, it’s important to note its limitations. It does not fully explain behaviours not directly linked to biological needs, such as curiosity-driven behaviours, and it may not account for why people engage in activities that increase tension or arousal, like thrill-seeking. This leads us to ask more questions about human motivation and behaviour, which is what psychology is all about!
Overall, drive-reduction theory provides a foundational understanding of how physiological needs, such as hunger, thirst, and the need for sleep, create psychological drives that powerfully influence our behaviour to meet these needs. In simple terms, this theory helps us understand why we feel driven to do things like eat, drink, and sleep: our body signals a physical need, and our mind pushes us to take action to meet that need.
We will now focus on one particular motivational drive: hunger. In this next section we will look at various aspects of hunger and other motivations for eating — or intentionally not eating. We will ask why we feel hungry, how our bodies signal us to eat, and what role hunger plays in our overall health. We’ll look at the science behind hunger, the debate around body weight, and the way society influences our eating habits. By focusing on hunger, we aim to understand not just the biological urge to eat but also how psychological and social factors play into our eating behaviours. Our exploration of hunger sheds light on not only this basic survival mechanism, but also the intricate web of motivations that drive our behaviours. We will discover that even our most primal needs depend on our psychological desires and our social relationships.
The Optional Arousal Model
Optimal Arousal Model builds on what we know about motivation. It says that we all have a “just right” level of alertness and energy that helps us do our best (Figure MO.10). If we’re not alert enough, we get bored and look for something to wake us up. If we’re too alert, or stressed, we try to find ways to relax (Berlyne, 1960). You’ve probably felt this during your time at school. Think about the end of the spring semester when everything seems to pile up. You might be stressed, trying to finish all your work. Then, summer comes, and you relax. But after a while, you start to feel bored. By the time Fall rolls around, maybe you are actually ready to get back to school. That’s the Optimal Arousal Model in action.
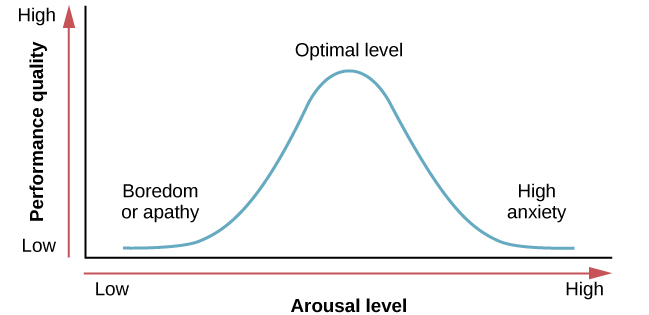
So, what’s this perfect level of alertness? Researchers have found that it is usually somewhere in the middle between really relaxed and really stressed (Yerkes & Dodson, 1908). Think about how you feel when you’re taking an exam. If you’re too relaxed, you might not do well because you don’t care enough. But if you’re too nervous, you might freeze up and not do well either. It’s like a softball team that’s so sure they’ll win, they don’t get pumped up for the game and end up losing to a team that’s not as good.
But it’s not always as simple as finding a middle ground. Researchers Robert Yerkes and John Dodson found that the best level of alertness depends on how hard the task is (Figure MO.11). They say that for easy tasks, it’s better to be more alert. But for hard tasks, it’s better to be less alert. This relationship is known as Yerkes-Dodson law, which holds that a simple task is performed best when arousal levels are relatively high and complex tasks are best performed when arousal levels are lower.

